I mine Monero (XMR), and the pool’s own website only tells you so much. It shows the here and now, it doesn’t tell you when a miner has quietly stopped, and it has no idea what your coins are worth. So I built my own dashboard: one page that shows the live pool stats, how each miner is doing, what XMR is worth in dollars, and a year of history behind all of it.
It runs in Docker on my homelab, and I keep it on a tab in my Home Assistant admin dashboard so it sits right next to everything else I keep an eye on. (If you’re curious how the rest of that is set up, I wrote about how I run Home Assistant.)
Pool stats
Workers
What it shows
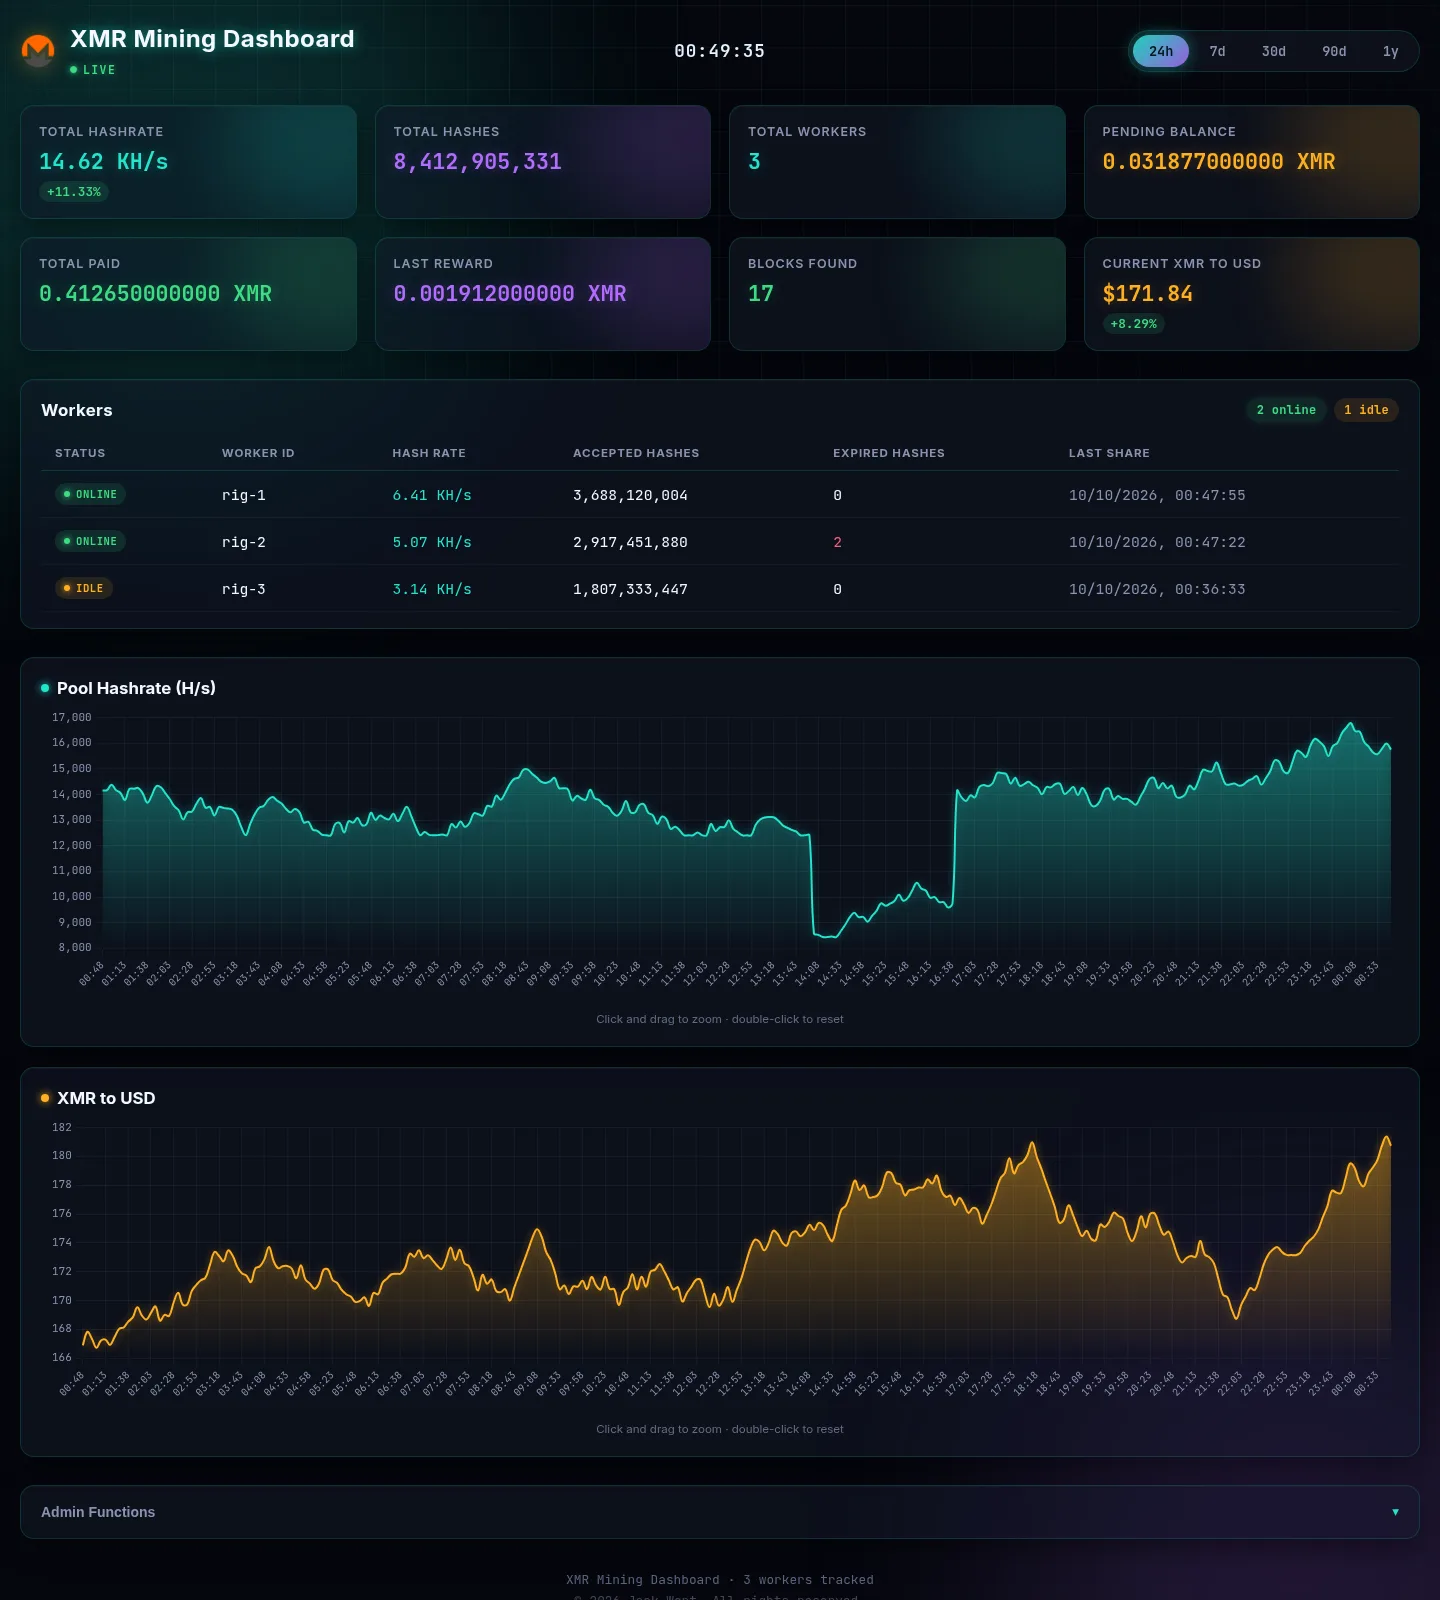
- Live pool stats. Hashrate, total hashes, number of workers, pending balance, total paid, the last reward and blocks found. The cards refresh every 5 seconds.
- Every worker, with a status. Each miner gets a status pill worked out from when it last sent a share to the pool: online if that was under 5 minutes ago, idle under 30 minutes, and offline after that. A miner that has crashed or lost its network shows up straight away instead of hiding in an average.
- XMR to USD. The current price, refreshed every 15 minutes.
- History charts. Hashrate and XMR/USD over 24 hours, 7 days, 30 days, 90 days or a year. You can click and drag across a chart to zoom into a particular stretch.
The look is a neon cyberpunk control room, because if you’re going to stare at a mining dashboard you might as well enjoy it.
How it’s built
It’s deliberately simple:
- Backend: Node.js and Express, split into small modules for the price feed, pool stats, history, scheduled jobs, email and the admin login.
- Frontend: Vue 3 and Chart.js loaded straight from a CDN. There’s no build step, so the front end is just files served as they are.
- Database: PostgreSQL, running in its own container next to the app. Docker Compose starts the database first and only starts the dashboard once the database passes its health check.
- Deployment: the code lives in my GitLab. A push builds a new image in CI and deploys it to the Docker host.
Pool stats
The stats come from the pool’s public API, which takes your wallet address and returns the numbers for that address. The dashboard caches the answer for 10 seconds, so lots of open browser tabs don’t turn into lots of calls to the pool. A scheduled job also saves a hashrate sample every 5 minutes, whether or not anyone has the page open, so the history has no gaps.
This is the bit that turns “last share” into a status:
export function classifyWorkerStatus(lastShareUnixSeconds) {
  const lastShare = Number(lastShareUnixSeconds);
  if (!Number.isFinite(lastShare) || lastShare <= 0) {
    return 'offline';
  }

  const ageMs = Date.now() - (lastShare * 1000);
  if (ageMs < 5 * 60 * 1000) {
    return 'online';
  }
  if (ageMs < 30 * 60 * 1000) {
    return 'idle';
  }
  return 'offline';
}
Price, with fallbacks
Free crypto price APIs go down or rate limit you more often than you’d think. The dashboard asks CoinGecko first, and if that fails it tries CoinCap, then Binance. As long as one of the three answers, the price stays up to date.
A year of history
Every price and hashrate sample goes into PostgreSQL. History is kept for at least 365 days. You can set it higher, but the app won’t let it go lower, so a typo in a setting can’t wipe out a year of data. Timestamps are deduplicated with a unique index, so a restart or a retry never draws the same point twice.
The dashboard started life storing its history in JSON files and then SQLite. When it moved to PostgreSQL, I made it migrate the old data across automatically the first time it starts with an empty database, so nothing was lost along the way.
Alerts and the daily email
Knowing a miner has stopped is the most useful thing the dashboard does.
- Offline alerts. If a worker goes quiet for more than 10 minutes (you can change this), it sends an email, and it sends another when the worker comes back. The pool also reports a fake “default” worker that never updates, so the alert check skips it. Otherwise it would cry wolf all day.
- Daily summary. Every morning at 10:00 it emails a summary of the mining stats and the current price.
Email goes out through Microsoft Graph using an app registration, rather than an SMTP password stored on the server.
Admin tools
There’s an optional admin panel, locked behind a password, with HMAC signed session cookies. From it I can:
- export the full price and hashrate history as JSON, which is handy before rebuilding the containers
- import a backup back in
- send a test daily email or a test offline alert, to check email still works
Keeping secrets out of the code
A dashboard like this needs a few things you really don’t want on the internet: your wallet address, the database password, the Microsoft Graph secret and the admin password. None of them are in the code. They all live in a .env file on the server, and git is set to ignore it. The repository only has a .env.example with placeholders, so anyone setting it up can see exactly what to fill in:
# Mining
XMR_WALLET_ADDRESS=your_xmr_wallet_address

# PostgreSQL
POSTGRES_PASSWORD=replace_with_strong_password

# Microsoft Graph email
GRAPH_TENANT_ID=your_tenant_id
GRAPH_CLIENT_ID=your_client_id
GRAPH_CLIENT_SECRET=your_client_secret
GRAPH_SENDER_EMAIL=notifications@example.com
GRAPH_RECIPIENT_EMAILS=you@example.com

# Optional admin lock
ADMIN_PASSWORD=
ADMIN_SESSION_SECRET=
The same goes for the screenshot and animation on this page: the numbers in them are made up, not my real stats.
What I’d tell anyone building one
- Store your own history. Pools only show you a short window. Once you’ve got a year of your own data, you can actually see trends.
- Alert on silence, not just errors. A miner that crashes doesn’t send an error, it just stops sending shares. Checking how long it has been since the last share is what catches it. It’s the same idea behind my one alert for the whole homelab, which watches my servers.
- Always have a backup data source. Free APIs fail. Two fallbacks cost a few lines of code and save you a blank price card.
- Keep secrets in the environment from day one. It’s much easier than cleaning a wallet address out of your git history later.
More projects
total 11